Knowledge Base
Working the Basis Diagram
What this page covers
"Reading the Basis Diagram" explains what the tree means and "How Basis Diagram Counts Are Derived" explains where its numbers come from. This page is the hands-on half: opening it, driving it, and getting an A3 sheet out of it.
The diagram lives on its own route, under a project: Basis Diagram in the project menu. It is not behind the AI Insights plan, and it does not call a model. It is a deterministic drawing of your own rows.
The sheet as it opens
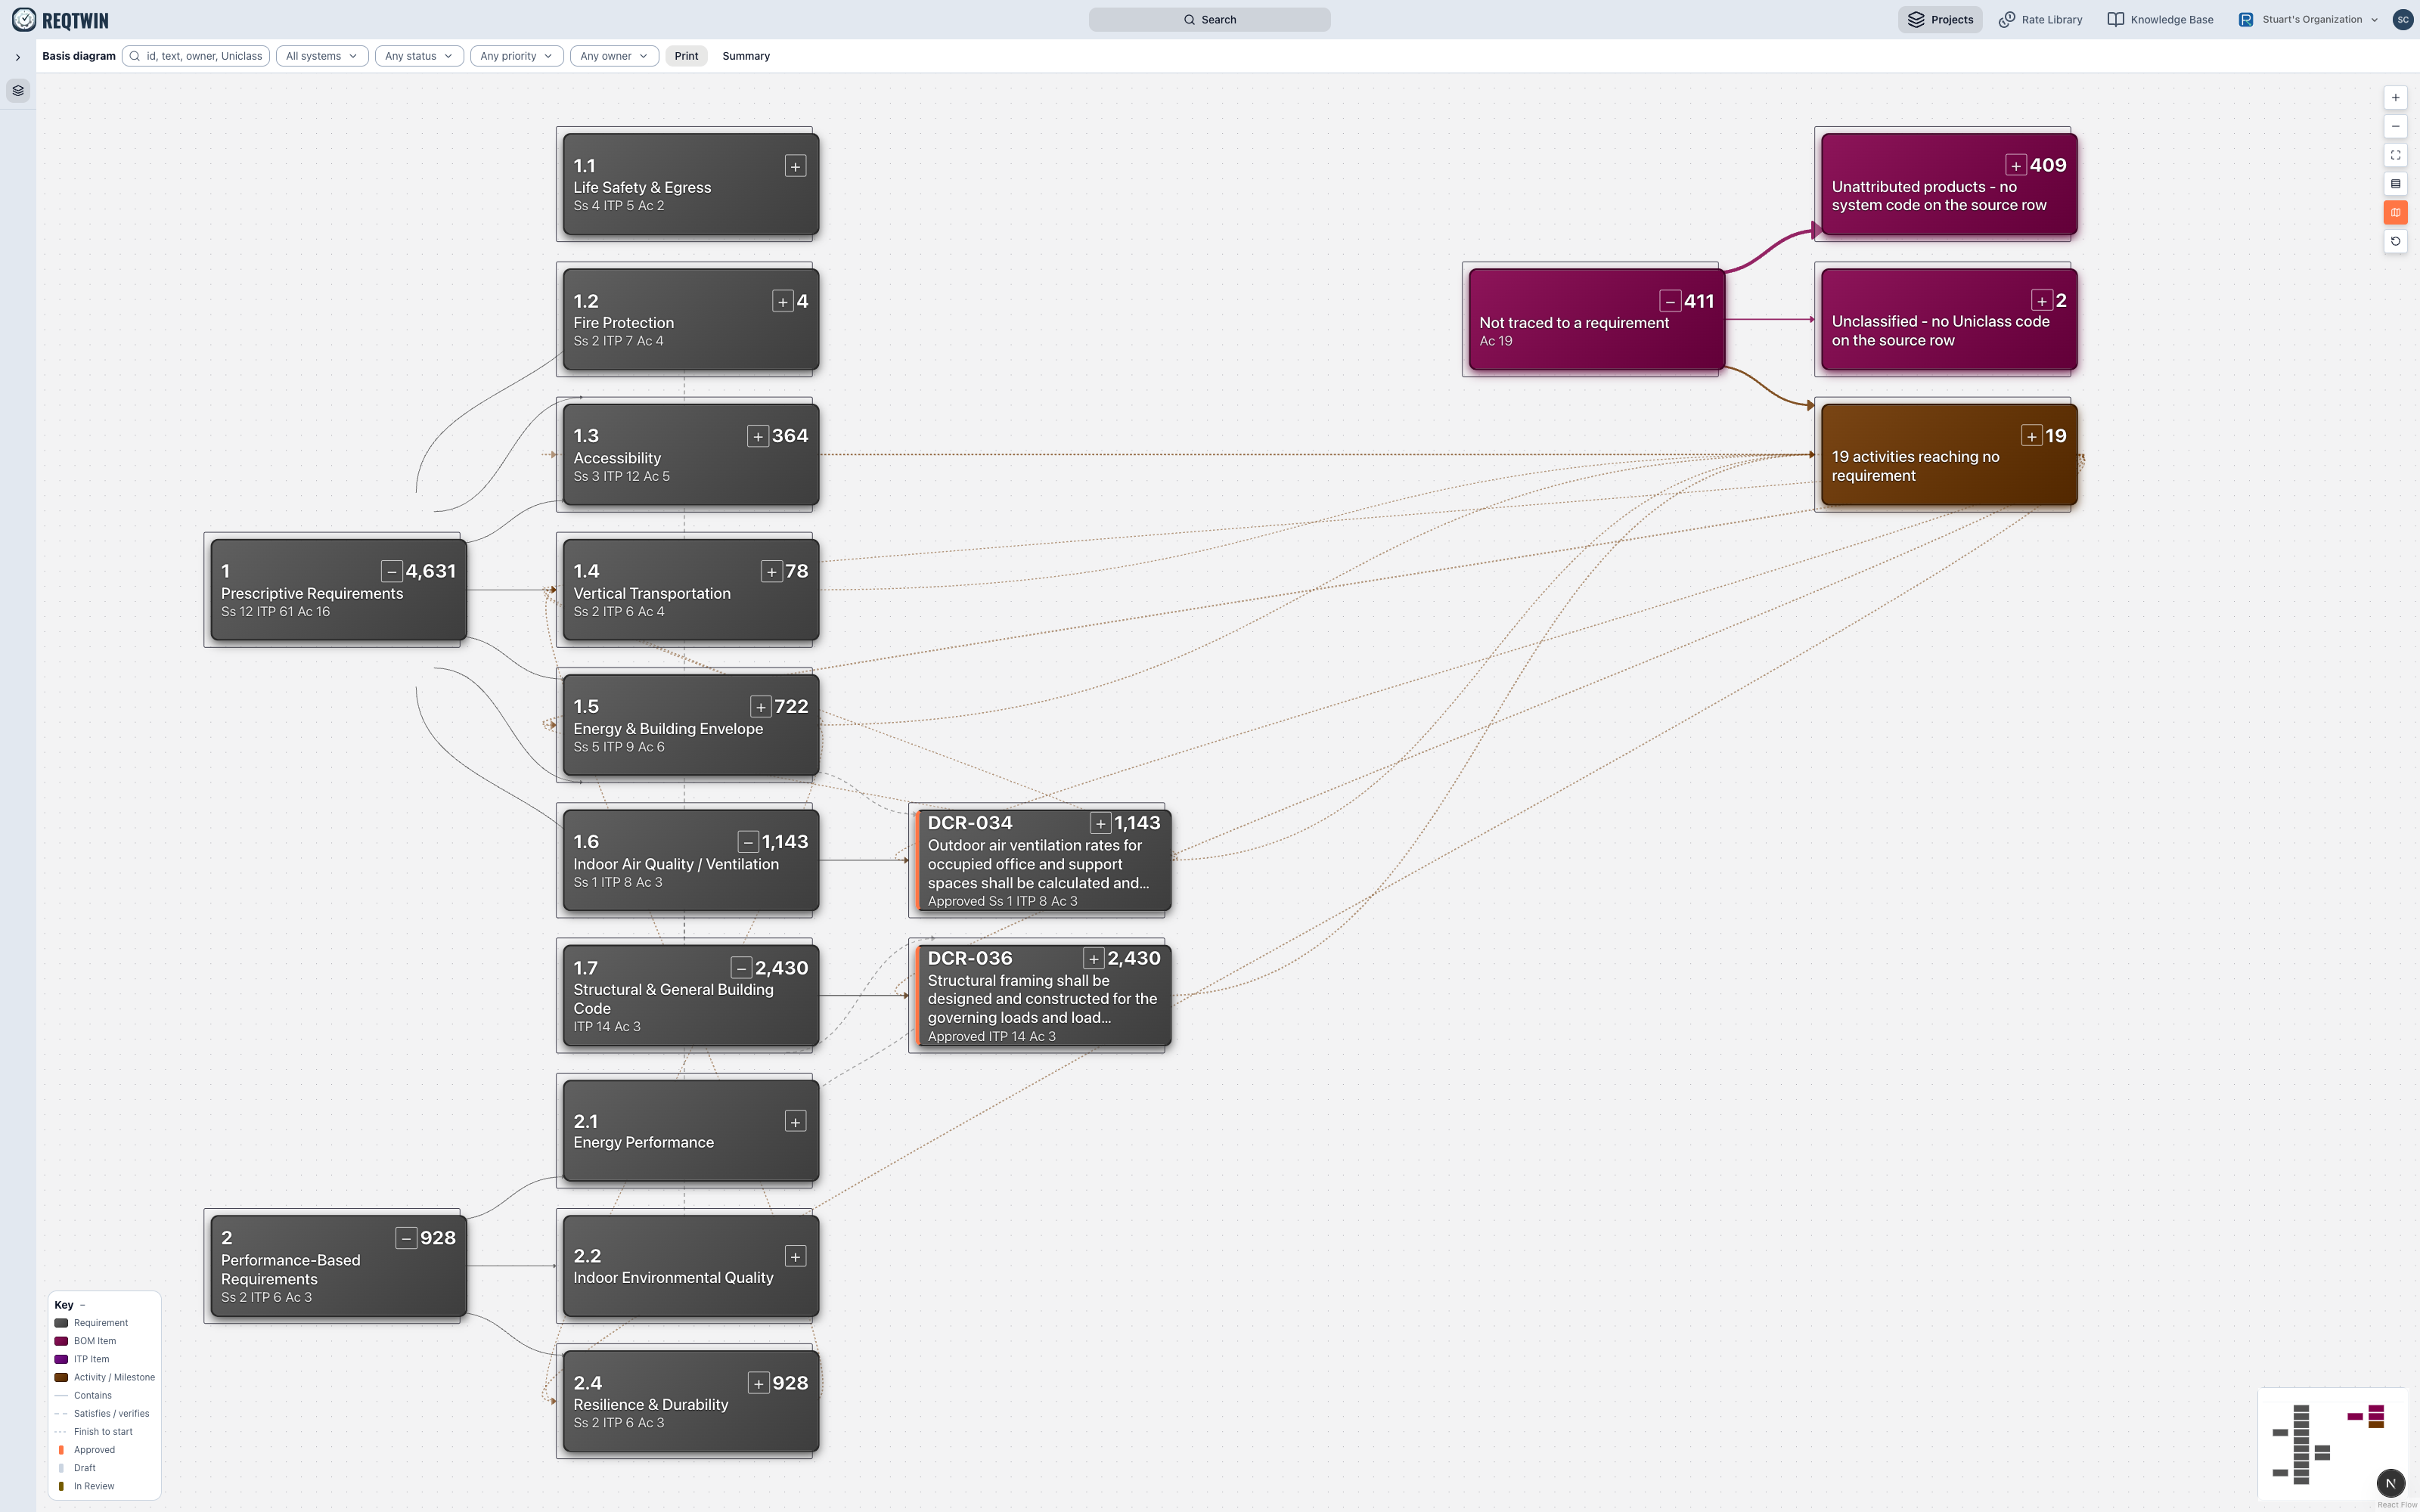
The Basis diagram on open: the requirement tree on the left, exception cards on the right, the key bottom-left and the view controls top-right.
It opens already expanded as far as one A3 landscape page can legibly carry, and no further. That is a deliberate budget, not a row cap: branches that stay shut still carry the totals of everything beneath them, so nothing is hidden from the counts by being collapsed.
The coloured cards on the right are the exceptions, and they are the reason to look at the sheet rather than a table. They are the rows that do not hang off a requirement: products with no system code, activities reaching no requirement, rows carrying no Uniclass code at all. A clean project has small numbers there.
Opening and closing branches
A card with children carries a + or a - next to its count. Clicking that toggles the branch. Clicking anywhere else on the card opens the inspector instead, so the two actions never fight over the same click.
From the keyboard, with a card focused:
| key | action |
|---|---|
| Enter or Space | open the inspector |
| Right arrow | expand the branch |
| Left arrow | collapse it |
The arrows are directional rather than a toggle, so holding one cannot flap a branch open and shut.
The inspector
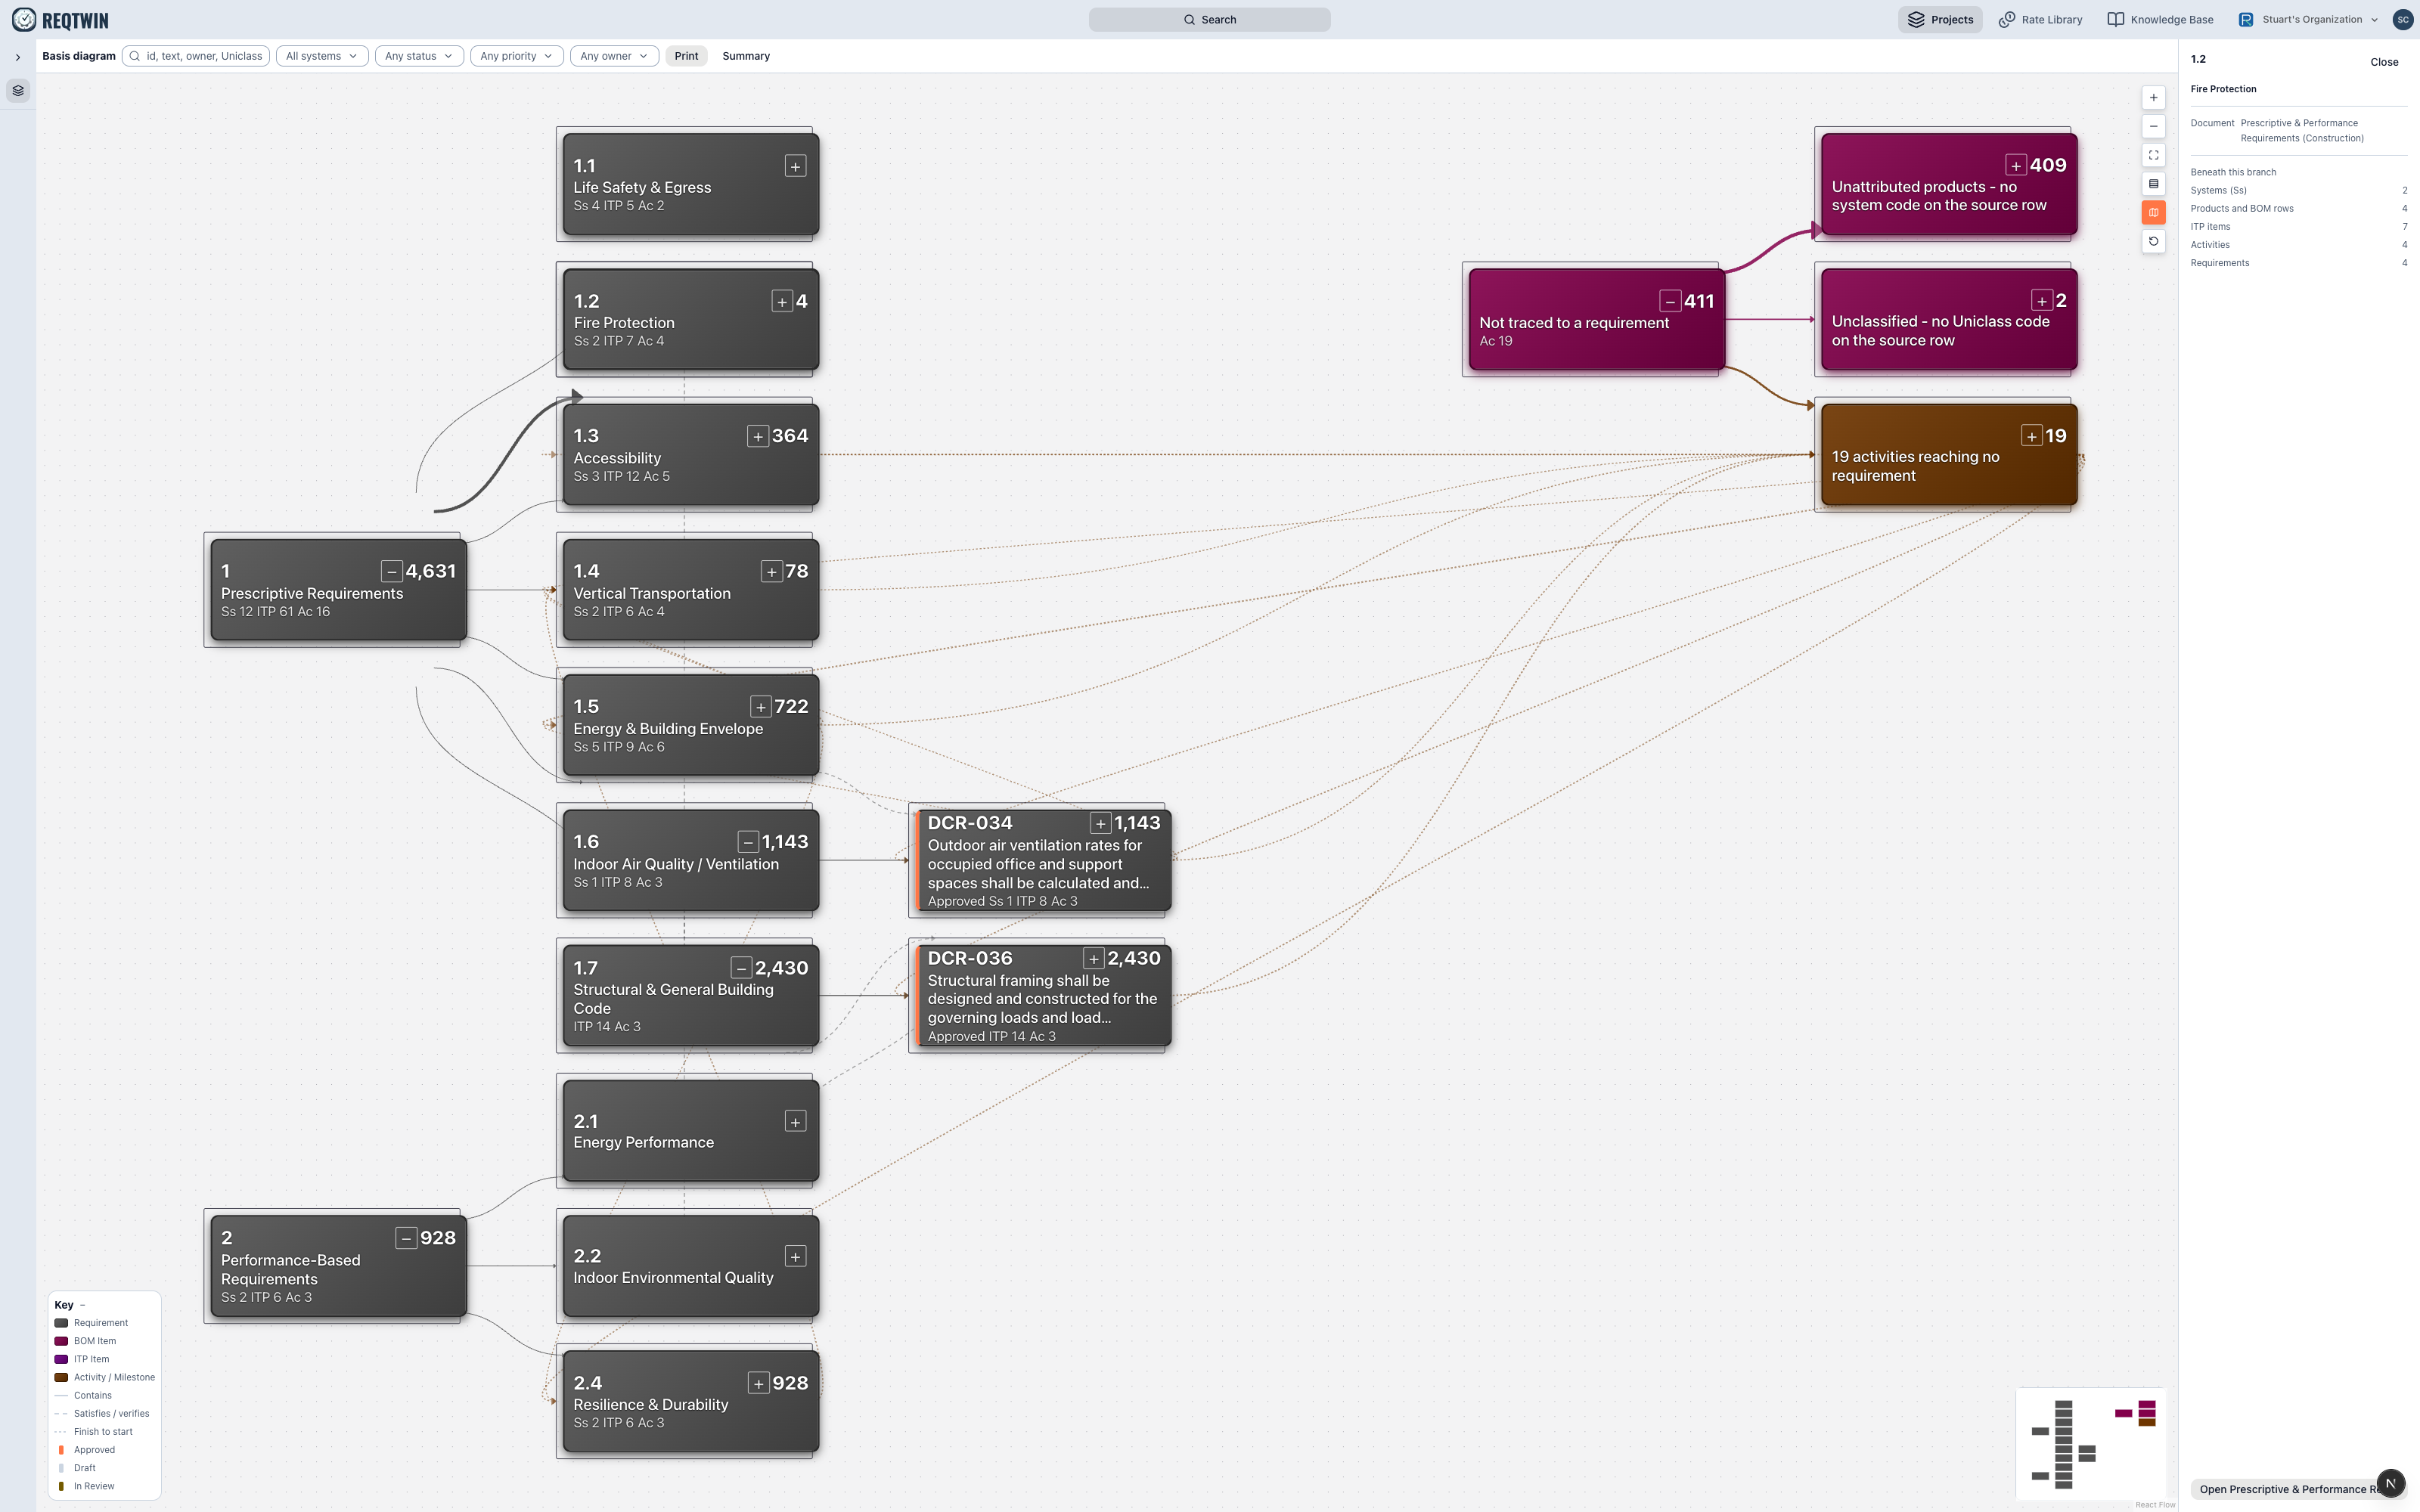
The inspector open on a branch: its document, and what sits beneath it by kind.
Selecting a card opens a panel on the right carrying what the card itself has no room for: the full untruncated text, the rationale and owner where the requirement has them, what sits beneath the branch by kind, and a link to the source document so you can go and edit the row you are looking at.
Filters
The row above the canvas filters by system, status, priority and owner, and the search box matches a requirement's own id, text, owner or Uniclass code.
Two things worth knowing. The facet lists are built from the unfiltered project, so a filter can always be undone from the control that set it. And filtering is the one thing here that genuinely removes rows, so when a filter is active the sheet says on its face how many requirements matched out of how many exist. A smaller tree never silently reads as a smaller project.
Summary
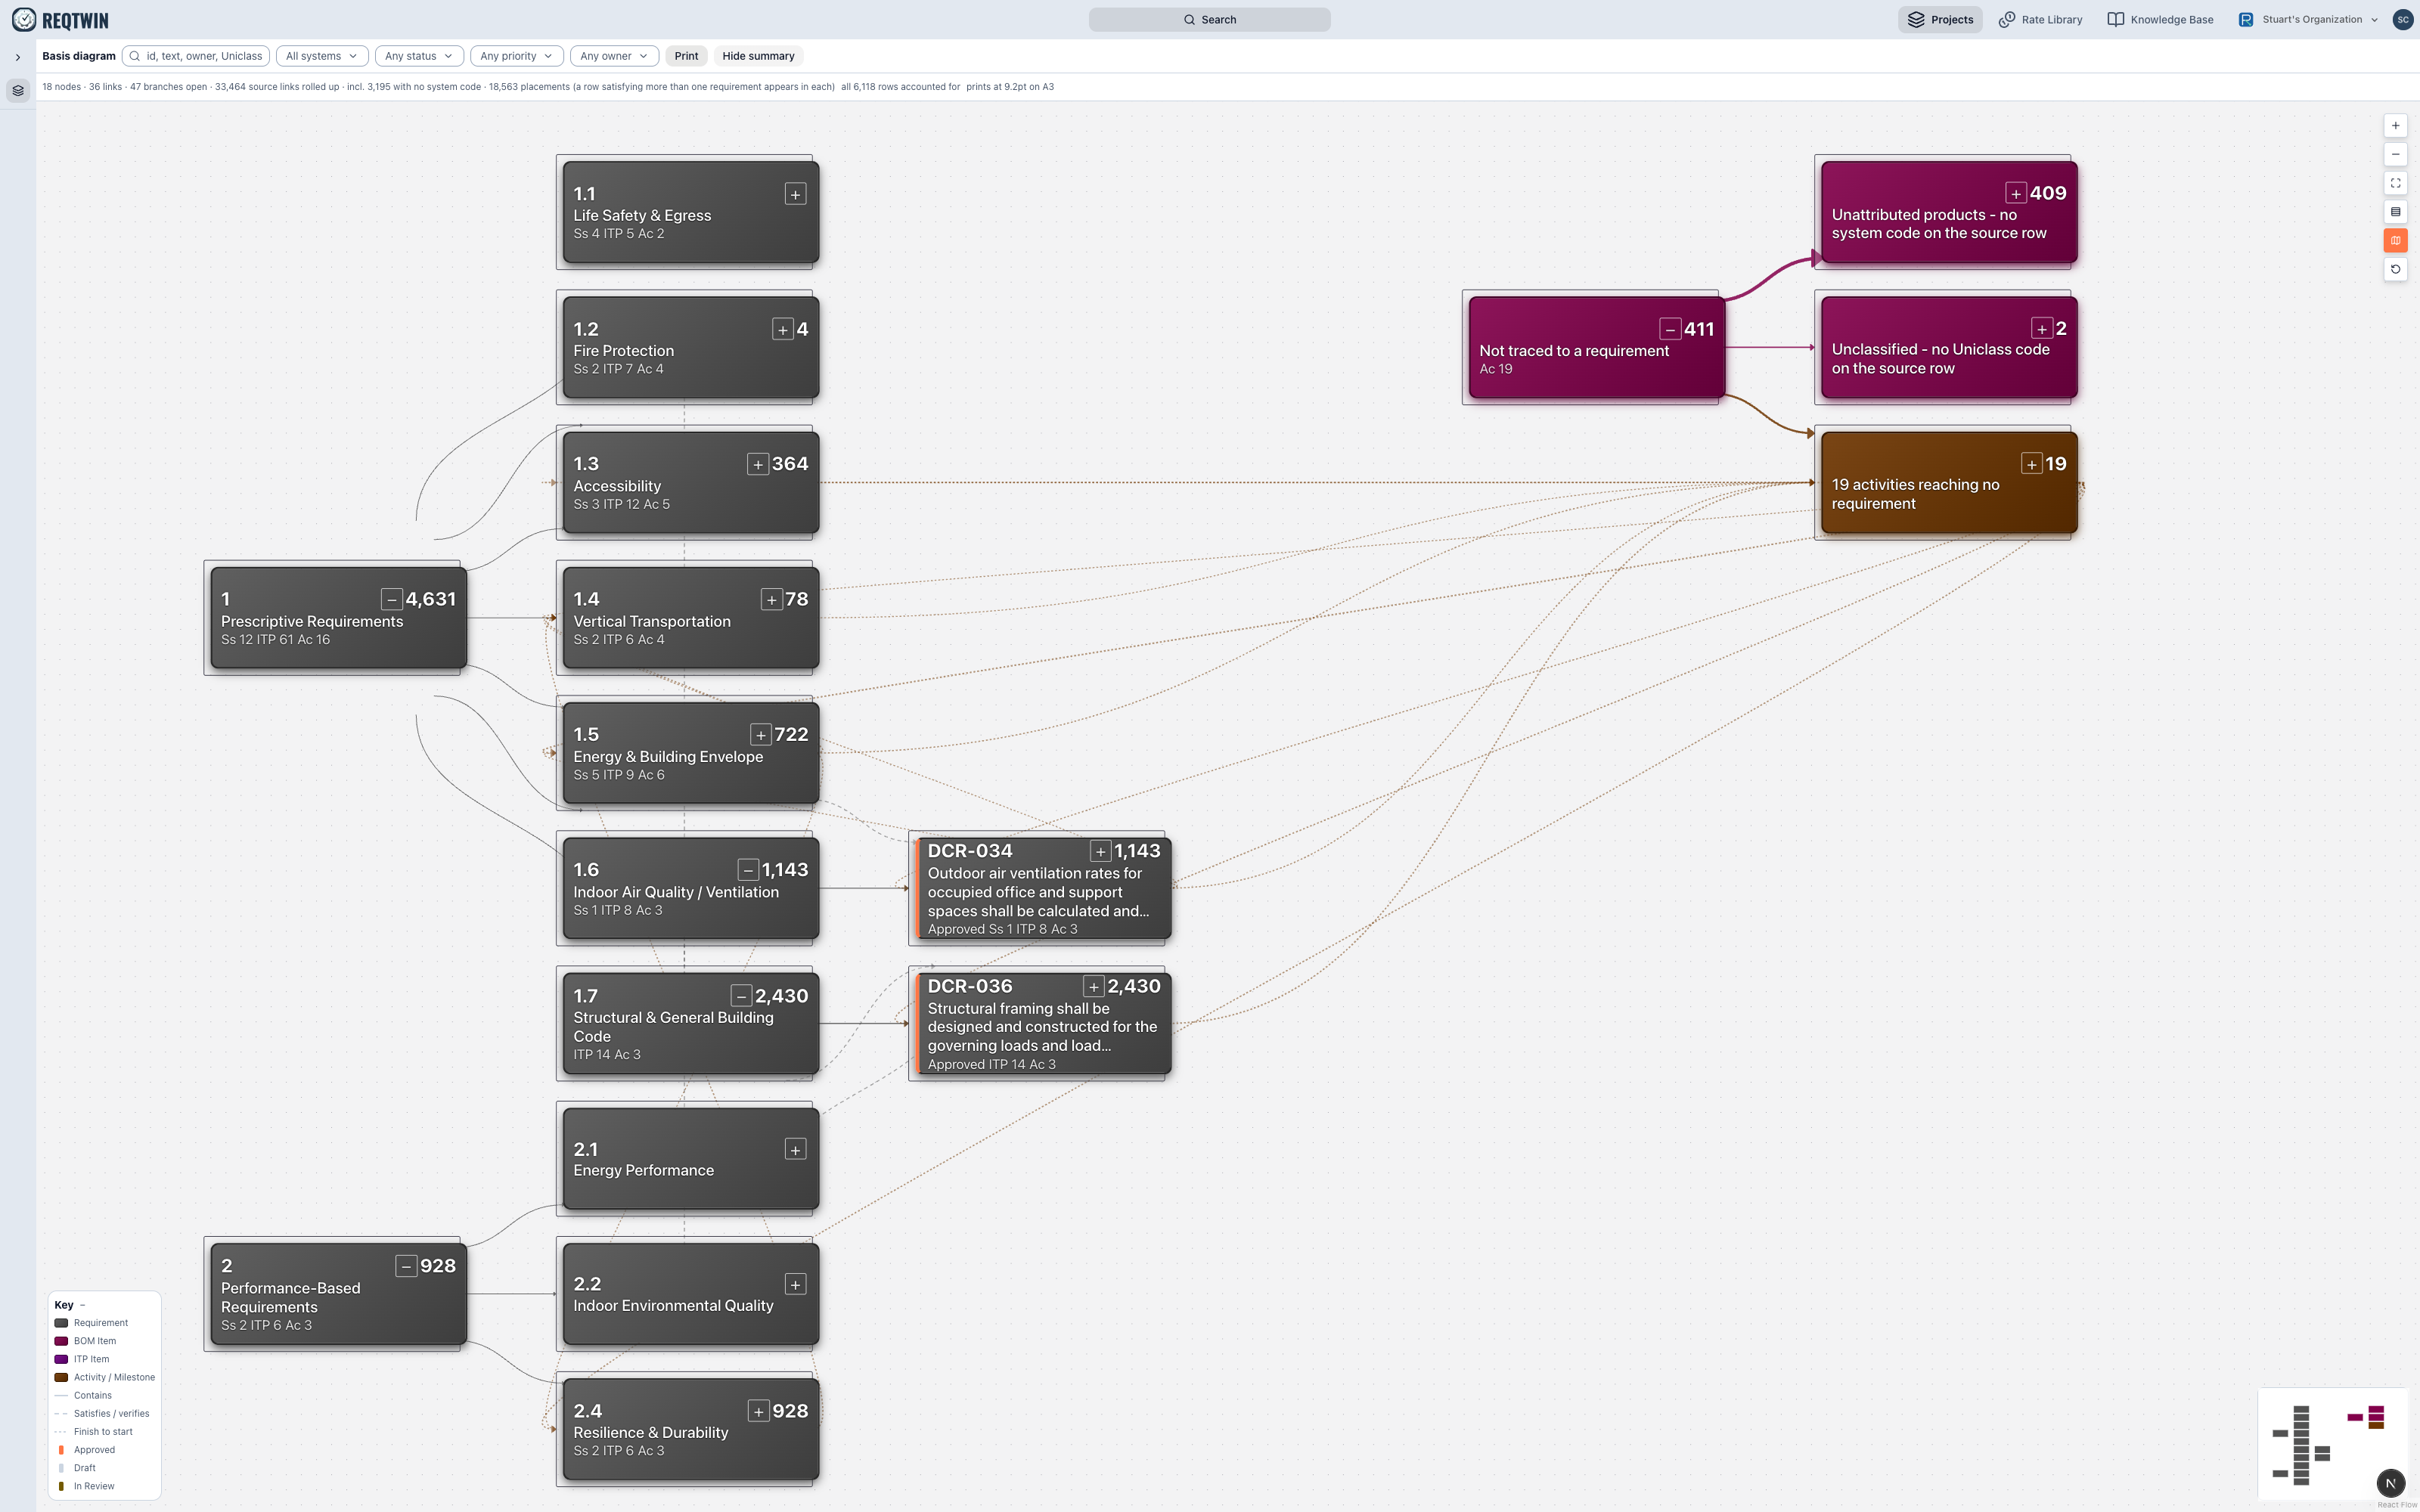
Summary expanded: nodes, links, source links rolled up and placements.
Summary expands one line above the drawing with the node, link and placement counts. If the tree ever fails to place a supplied row it adds a red MISMATCH line naming the kind and the shortfall.
Exporting a PDF
Export PDF builds an A3 landscape PDF of the tree exactly as drawn: the same density, filters and open branches, with the whole tree on one page rather than whatever you had panned to. It is vector, so it stays sharp at any zoom, and it carries the project name, the date, the filter state, the reconciliation figures and the key.
The view controls
Top right, in order: zoom in, zoom out, fit the whole tree, switch between normal and dense spacing, show or hide the overview map, and reset.
Dense changes spacing only, never what is drawn or what is counted. It fits more of the tree into the same page, which is why it can open further before it runs out of legible type.
Reset returns both halves of the view: the branches go back to the expansion the page opened with, and the pan and zoom are re-fitted.
An empty project
A new project has no requirements until you add a document, so the diagram opens empty and links straight to the project overview, which is where documents are created. If the diagram is empty and you believe it should not be, check whether a filter is still active: that case says "No requirements match" and offers a Clear button, which is a different message from "Nothing to draw yet".